Ultrasound examination
Examination protocol
Ventral view
- Sagittal plane
- Transverse plane
Medial view
- Transverse plane
Lateral view
- Transverse plane
Dorsal view
- Sagittal plane
- Transverse plane
Plantar view
- Sagittal plane
- Transverse plane
View of the first MTP joint
- Sagittal plane
Interactive feature, available in the app
1. Ventral view
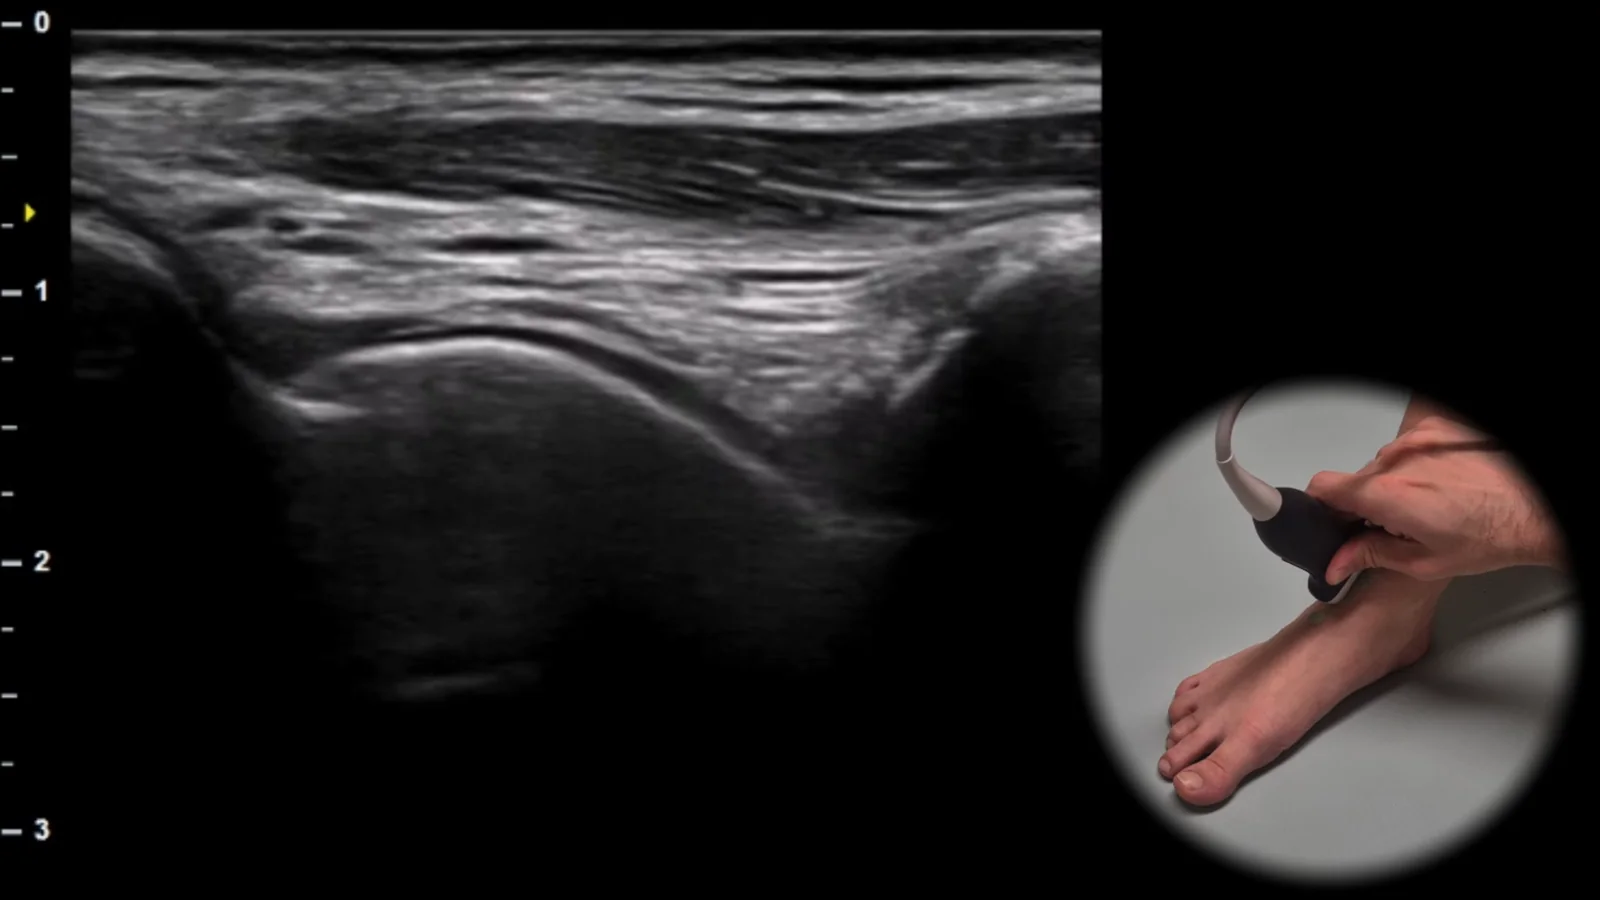
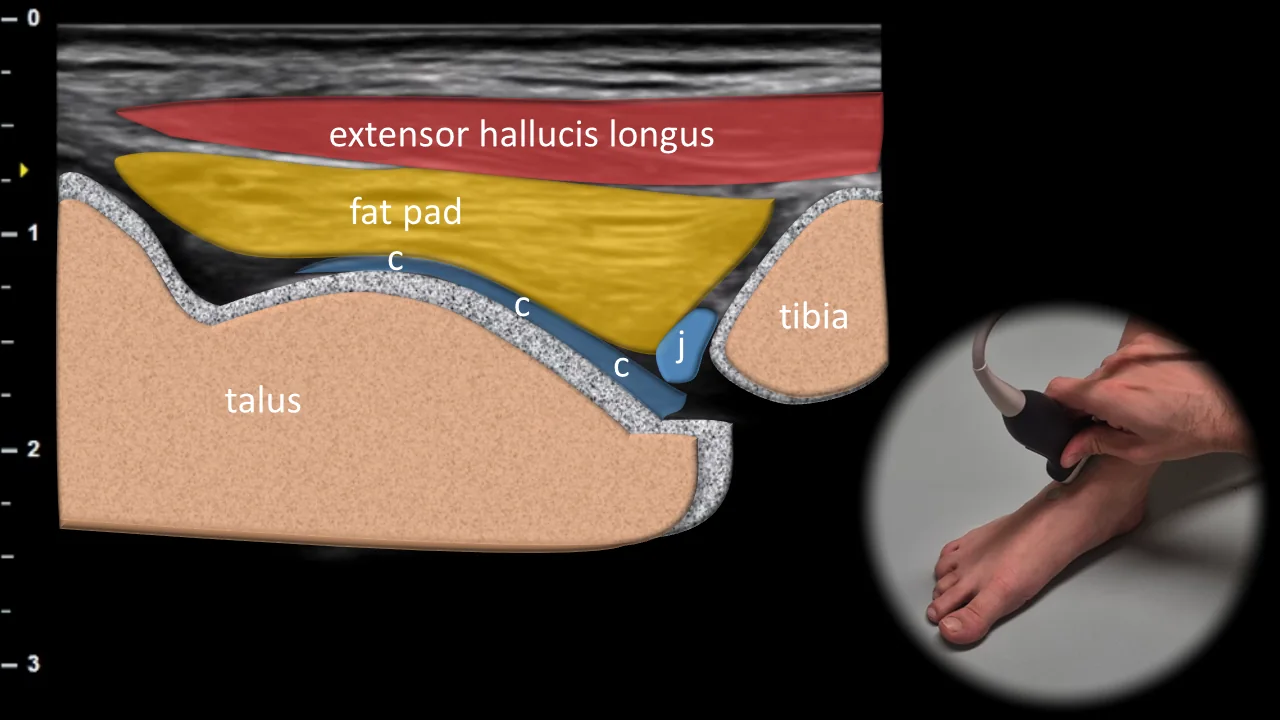
Figure 1. Ventral view, sagittal plane. c: cartilage, j: fluid in joint cavity
Longitudinal ultrasound section of the anterior part of the ankle joint showing the tibiotalar articulation area. Superficially, the course of m. extensor hallucis longus is visible, transitioning distally into a tendon that runs over the anterior fat pad. Below it, the joint cavity with the anterior recess (j) and cartilage (c) covering the articular surface of the talus are shown, appearing as a thin hypoechoic layer adjacent to the curved hyperechoic cortical line. This projection is essential for evaluating the anterior recess of the ankle joint, presence of effusion, synovial hypertrophy, and integrity of articular cartilage in the tibiotalar articulation area.
Clinical Note
In this projection, swelling and fluid in the talocrural (TC) joint can be well detected, which lead to expansion of the anterior joint recess.
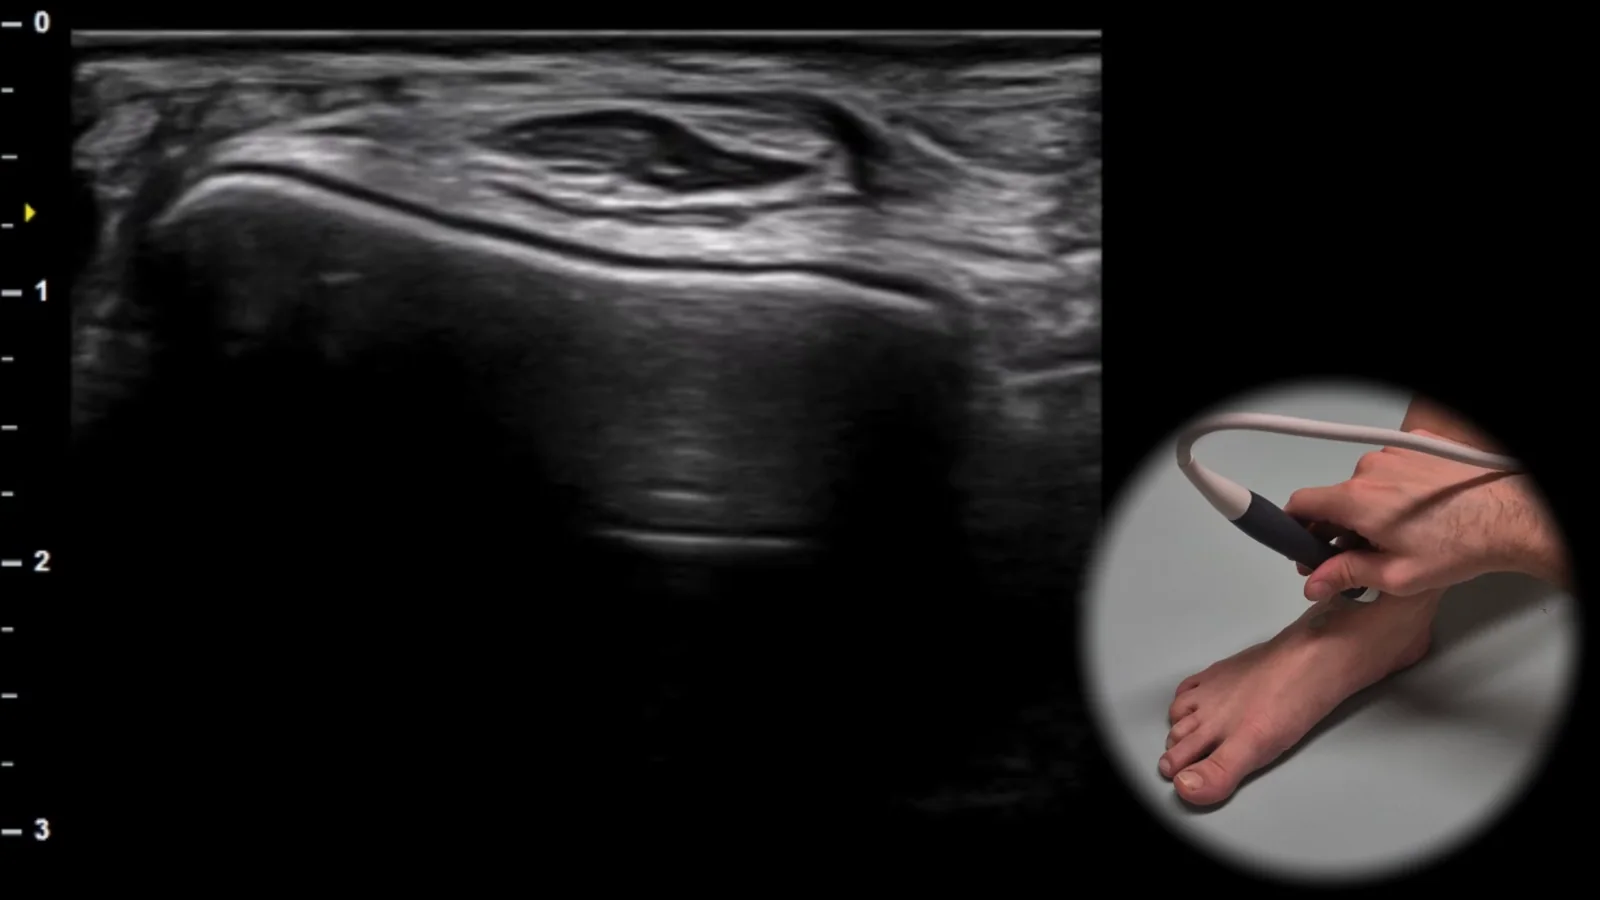
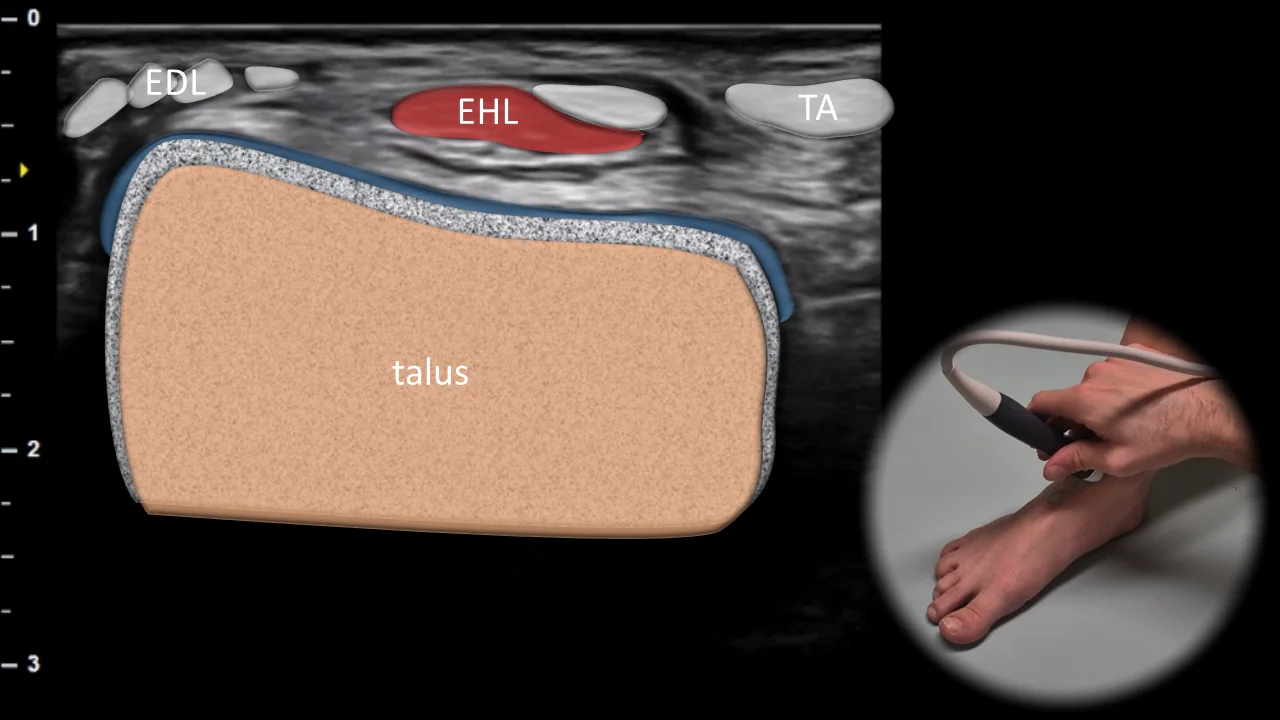
Figure 2. Ventral view, transverse plane. EDL: m. extensor digitorum longus, EHL: m. extensor hallucis longus, TA: m. tibialis anterior
Transverse ultrasound section of the anterior part of the ankle showing the talar dome as the main bony landmark. Superficially above the talus, the tendons of m. extensor digitorum longus (EDL), m. extensor hallucis longus (EHL) and m. tibialis anterior (TA) are visible, running parallel to each other under the retinaculum in the anterior part of the ankle. This projection is essential for evaluating the extensor tendons in the ankle region and for detecting tendinopathy, tenosynovitis, or other pathological changes in their sheaths.
2. Medial View
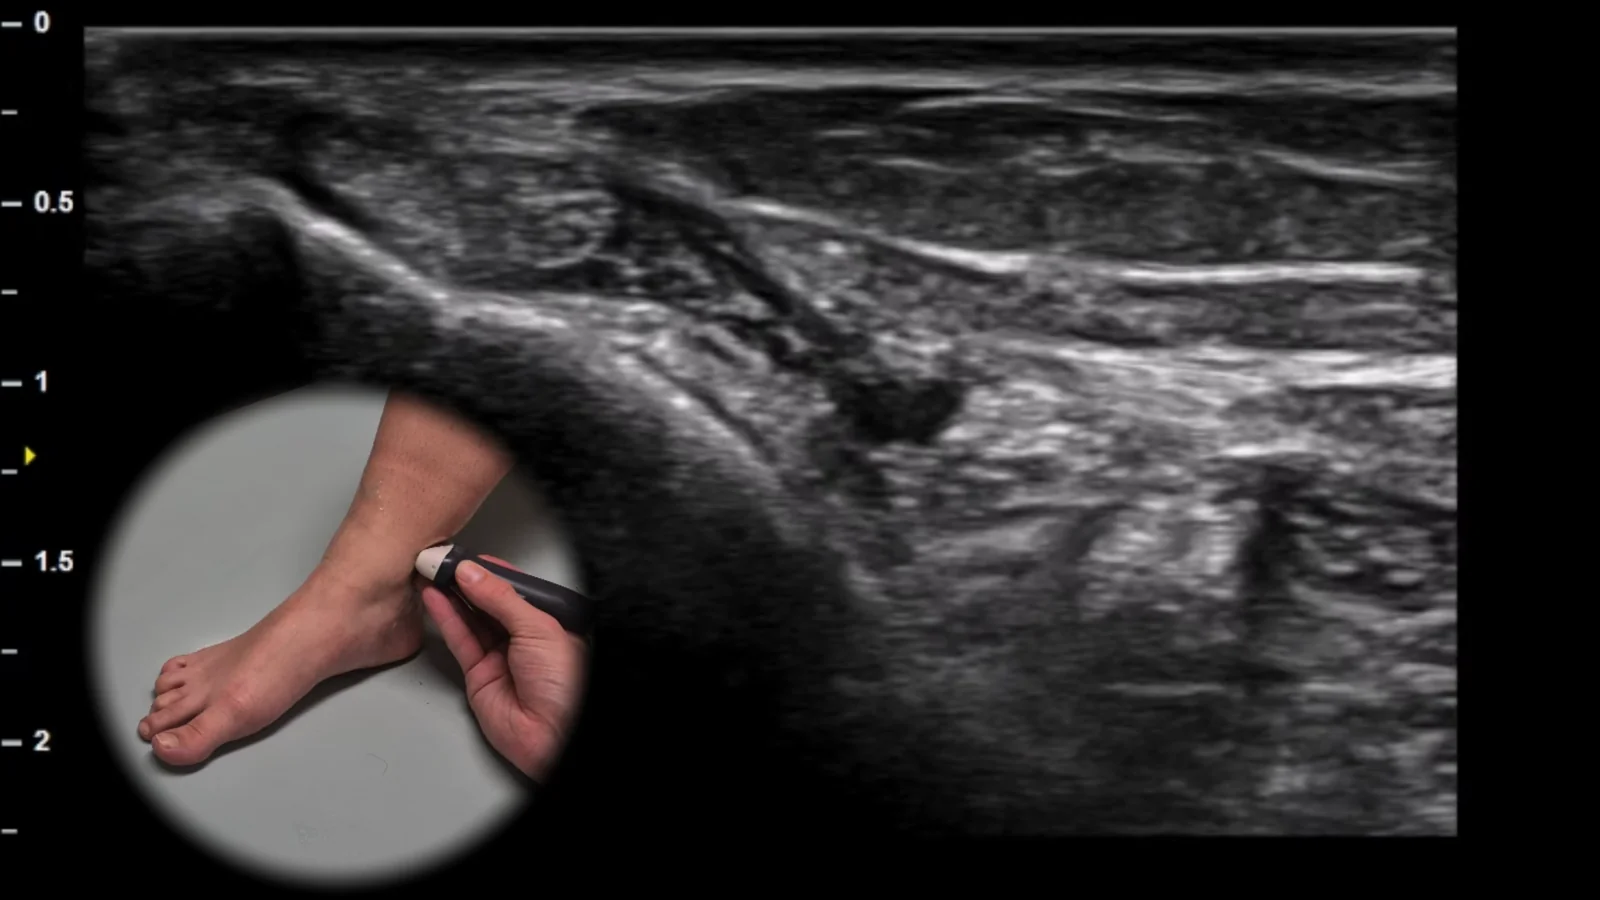
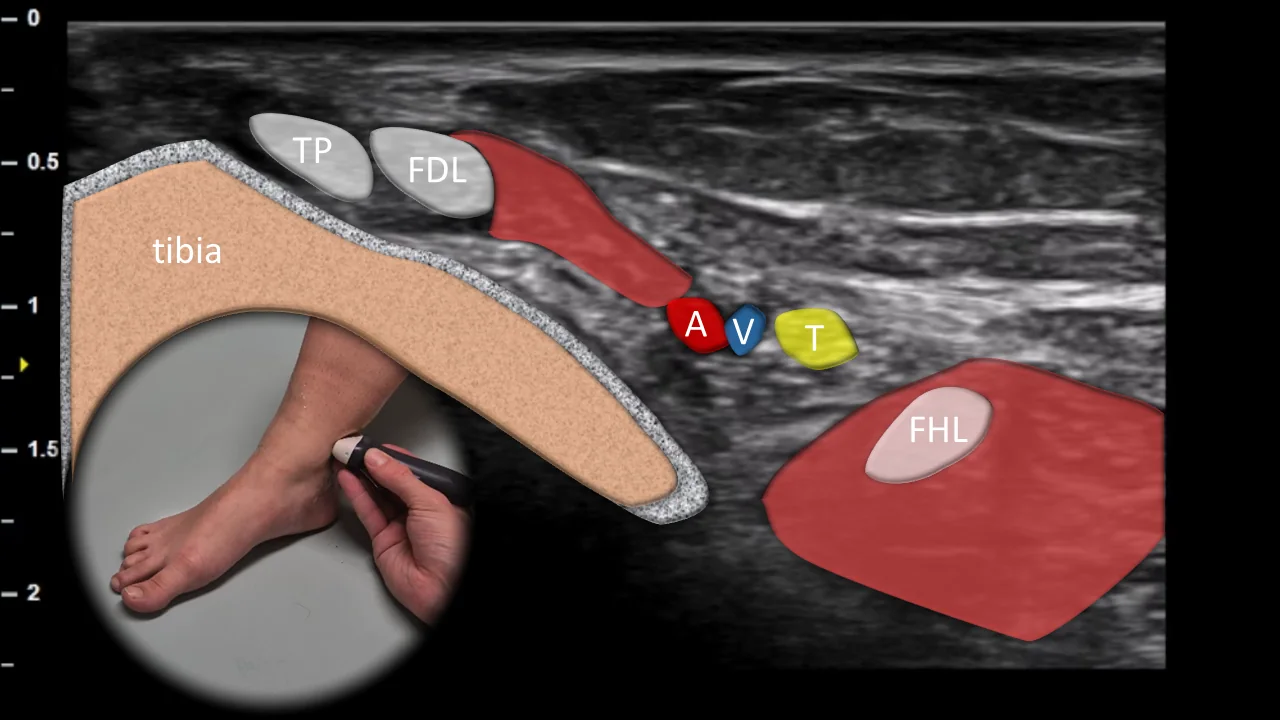
Figure 3. Medial view, transverse plane. TP: tibialis posterior tendon, FDL: flexor digitorum longus tendon, FHL: flexor hallucis longus tendon, A: posterior tibial artery, V: posterior tibial veins, T: tibial nerve
Transverse ultrasound section of the medial aspect of the ankle in the tarsal tunnel region. The medial malleolus is shown as the main bony landmark, behind which the tendons of tibialis posterior (TP), flexor digitorum longus (FDL), and flexor hallucis longus (FHL) are visible, arranged in typical sequence in the area behind the medial malleolus. Between the FDL and FHL tendons, the neurovascular bundle is located, consisting of the posterior tibial artery (A), accompanying veins (V), and tibial nerve (T). This projection is essential for evaluating tendon tenosynovitis, tarsal tunnel pathology, and potential compression of the tibial nerve or other neurovascular structures.
3. Lateral View
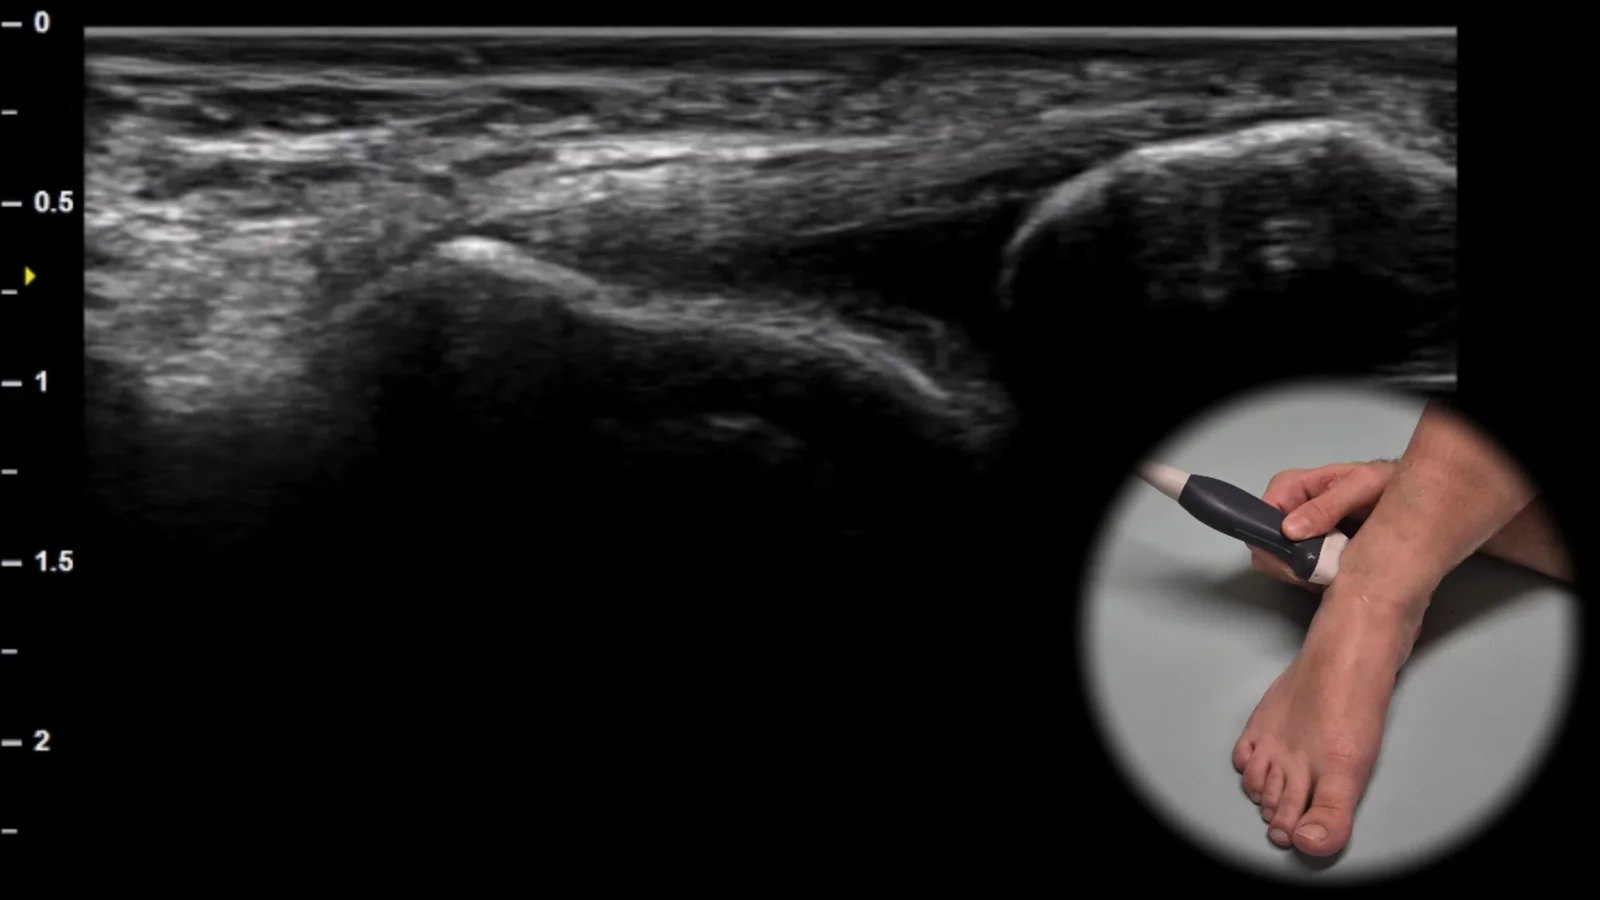
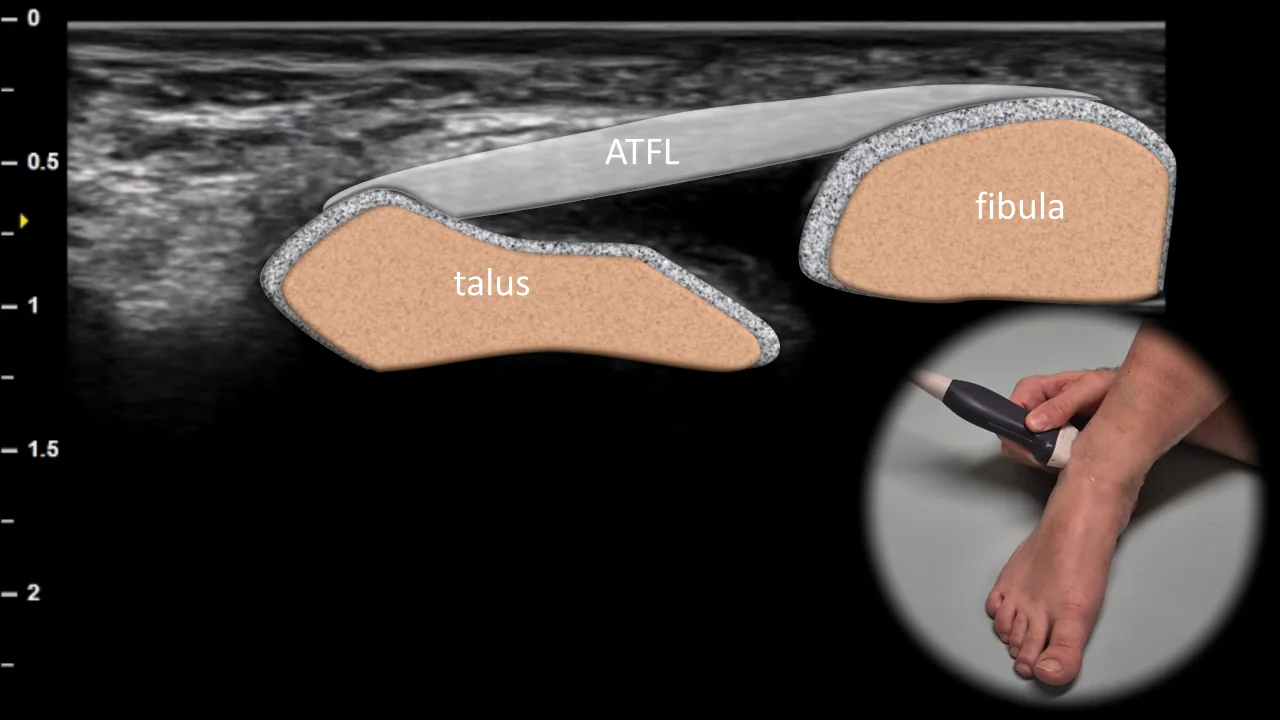
Figure 4. Lateral view, transverse plane. ATFL: ligamentum talofibulare anterius
Transverse ultrasound section of the lateral part of the ankle showing the ligamentum talofibulare anterius (ATFL) as a thin hyperechoic fibrillar structure running between the anterior border of the fibula and the lateral part of the talar neck. The fibula and talus form the main bony landmarks of this projection, with the ligament bridging the anterior part of the lateral ankle complex. This projection is essential for evaluating the continuity, echotexture, and tension of the ATFL when lateral ankle sprain, partial rupture, or complete lesion is suspected.
4. Dorsal View
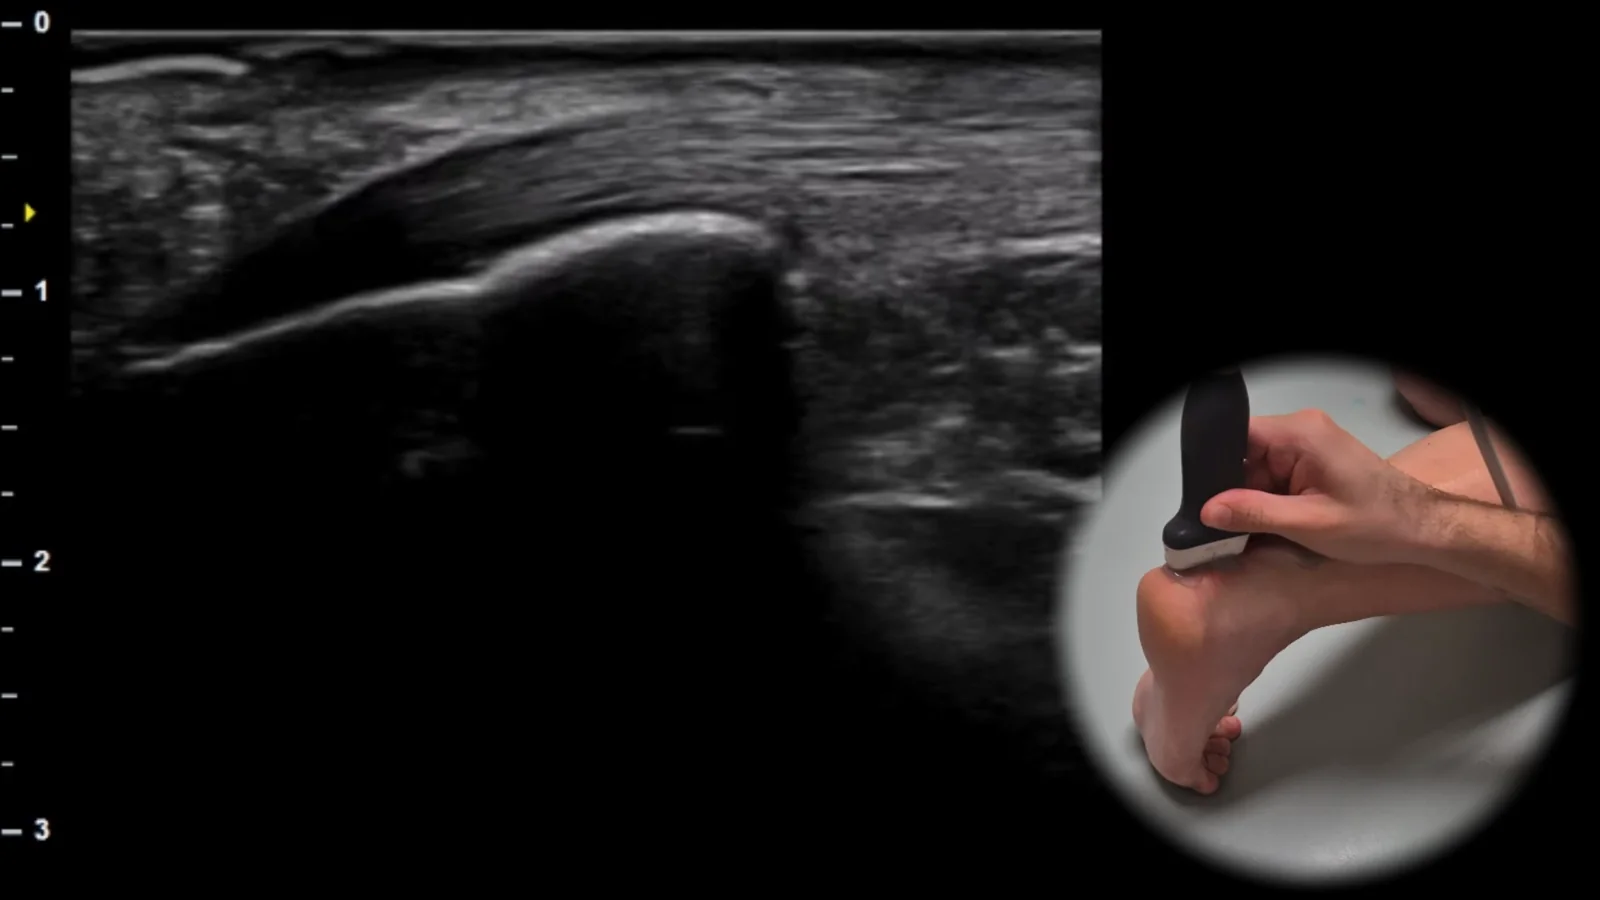
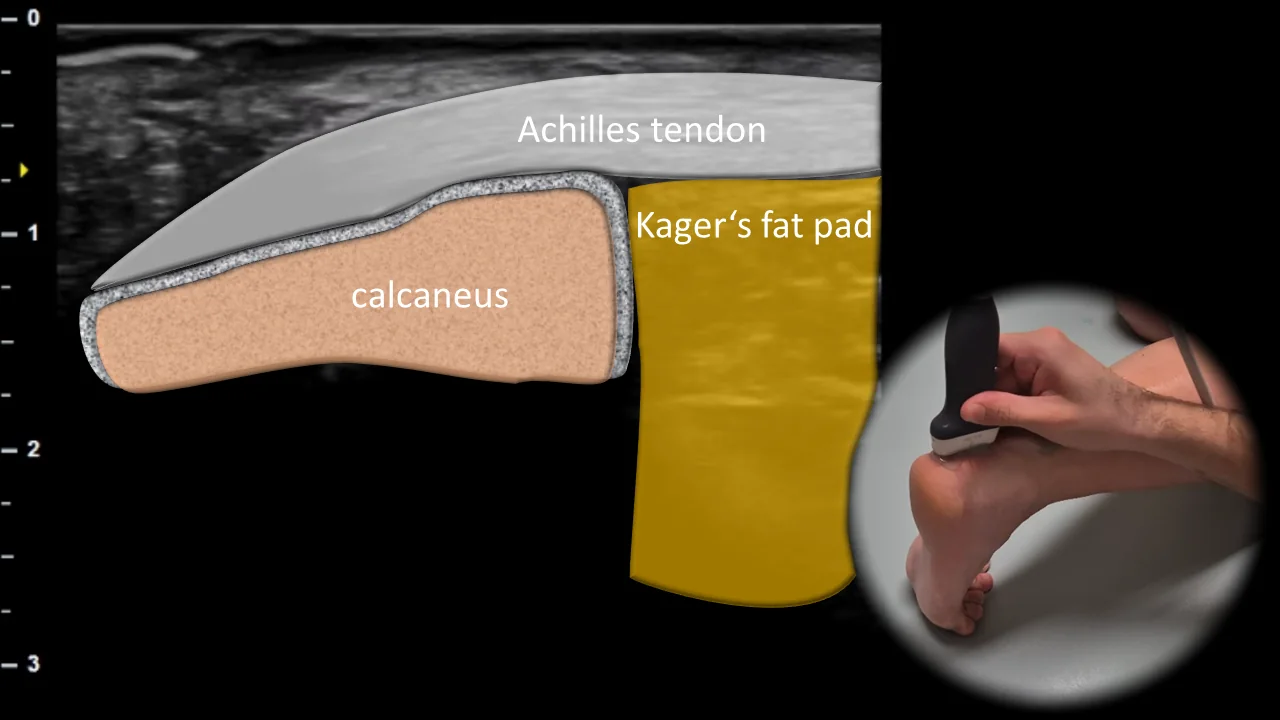
Figure 5. Dorsal view, sagittal plane.
Longitudinal ultrasound section of the posterior ankle showing the Achilles tendon as a thick hyperechoic fibrillar band running to its insertion on the calcaneus. Below the tendon, Kager's fat pad is visible, which forms an important anatomical landmark in the posterior ankle and contributes to clear visualization of the relationship between the Achilles tendon and the calcaneus. This projection is essential for assessing Achilles tendon continuity, detecting tendinopathy, partial ruptures, and signs of retrocalcaneal bursitis or changes in surrounding soft tissues.
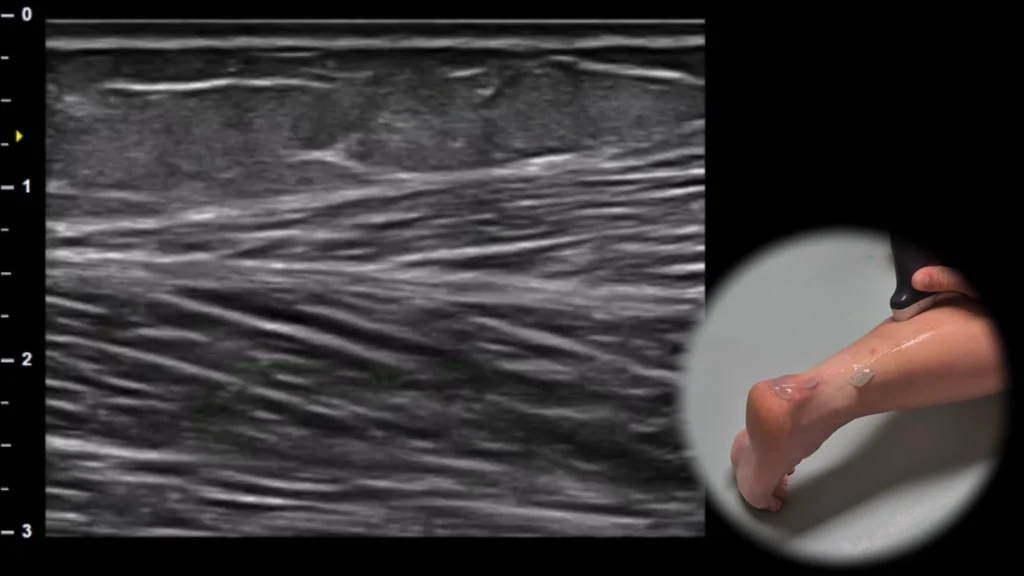
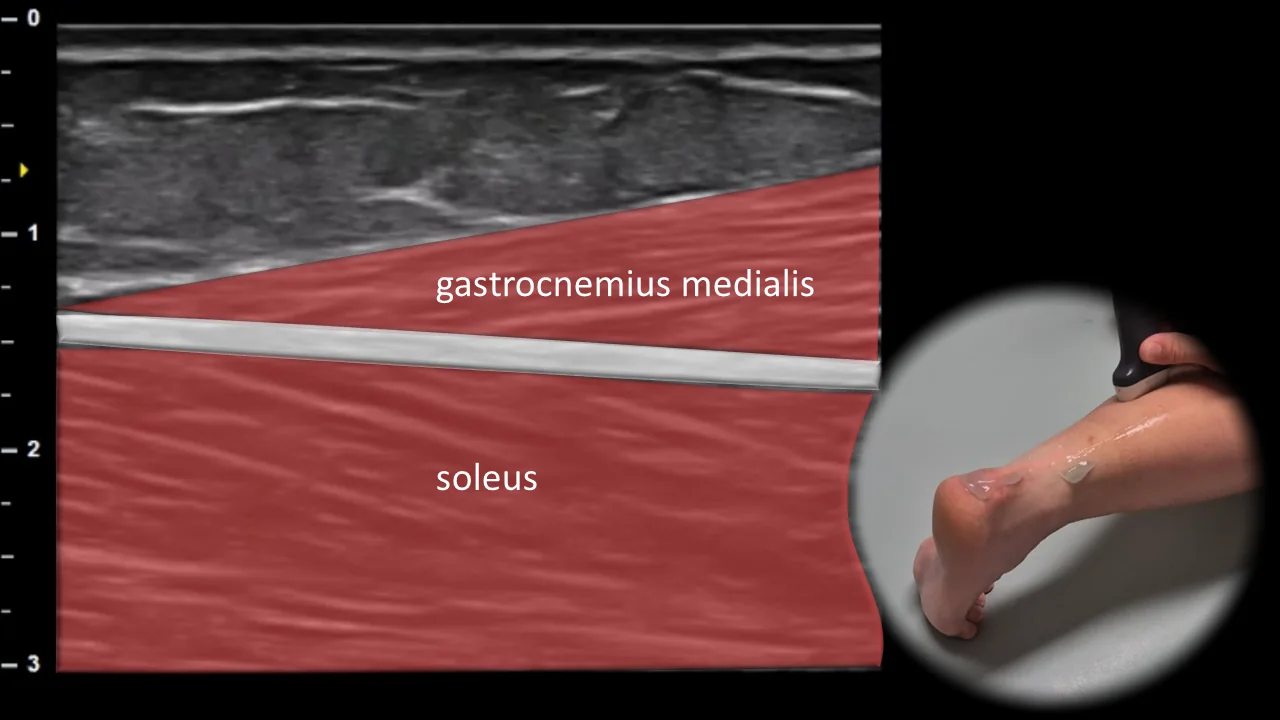
Figure 6. Dorsal view, sagittal plane.
Longitudinal ultrasound section of the posterior calf showing the myotendinous interface of m. gastrocnemius medialis and m. soleus. The m. gastrocnemius medialis is visible superficially, m. soleus deeper, and between them an aponeurotic line, which forms an important landmark of this projection. This projection is essential for evaluating the myotendinous junction of m. triceps surae and for detecting muscle ruptures, hematomas, or other lesions in the area of the medial head of m. gastrocnemius and m. soleus.
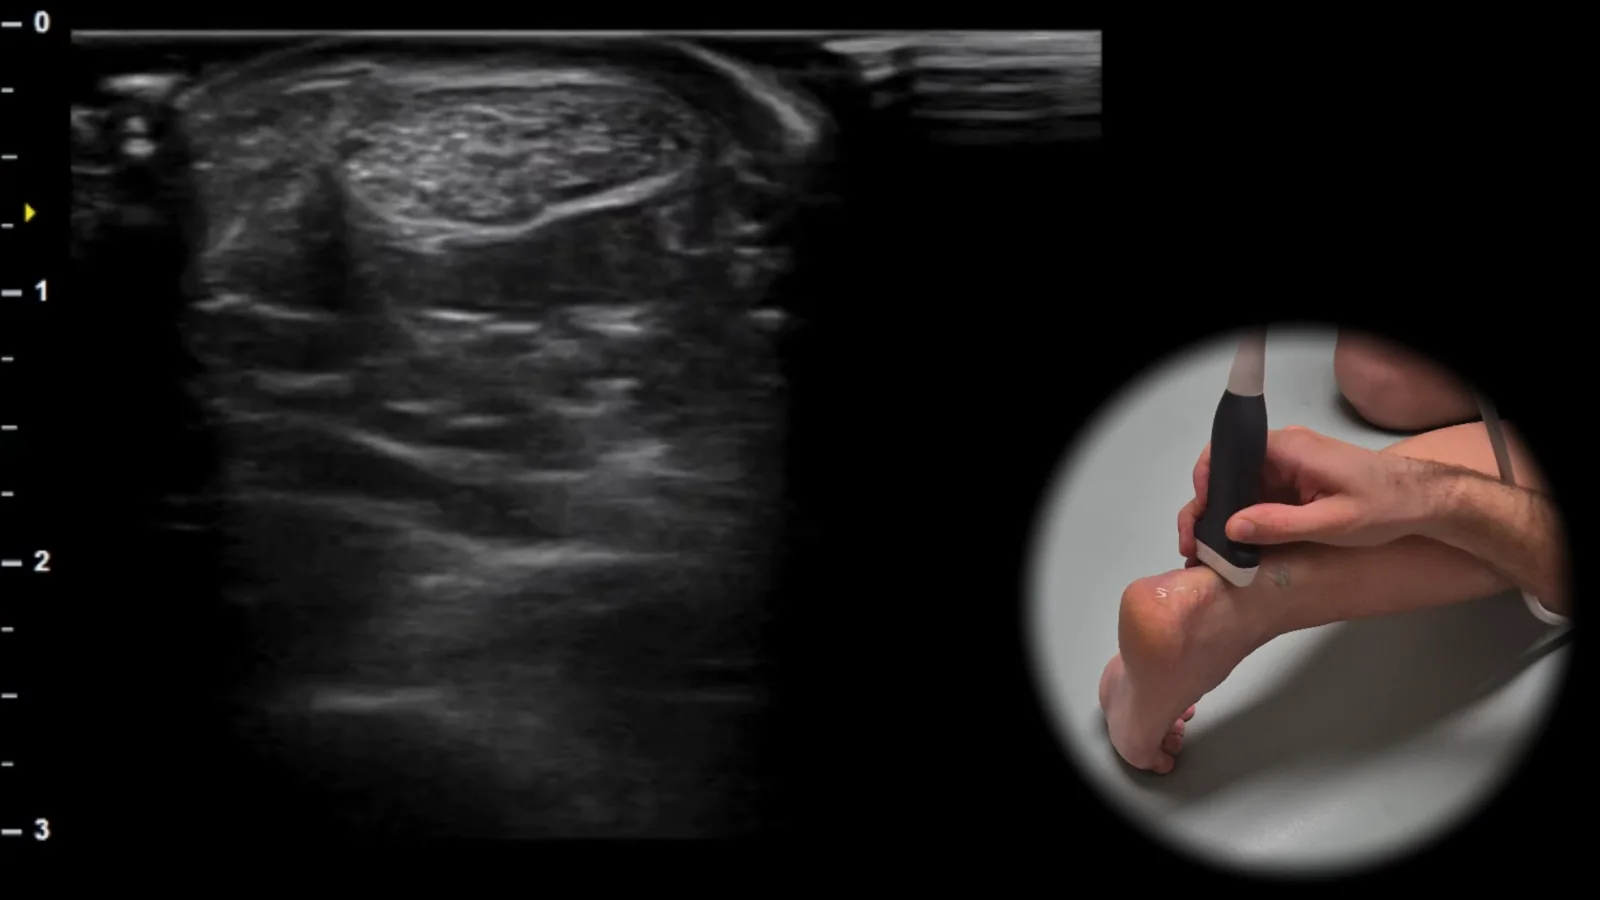
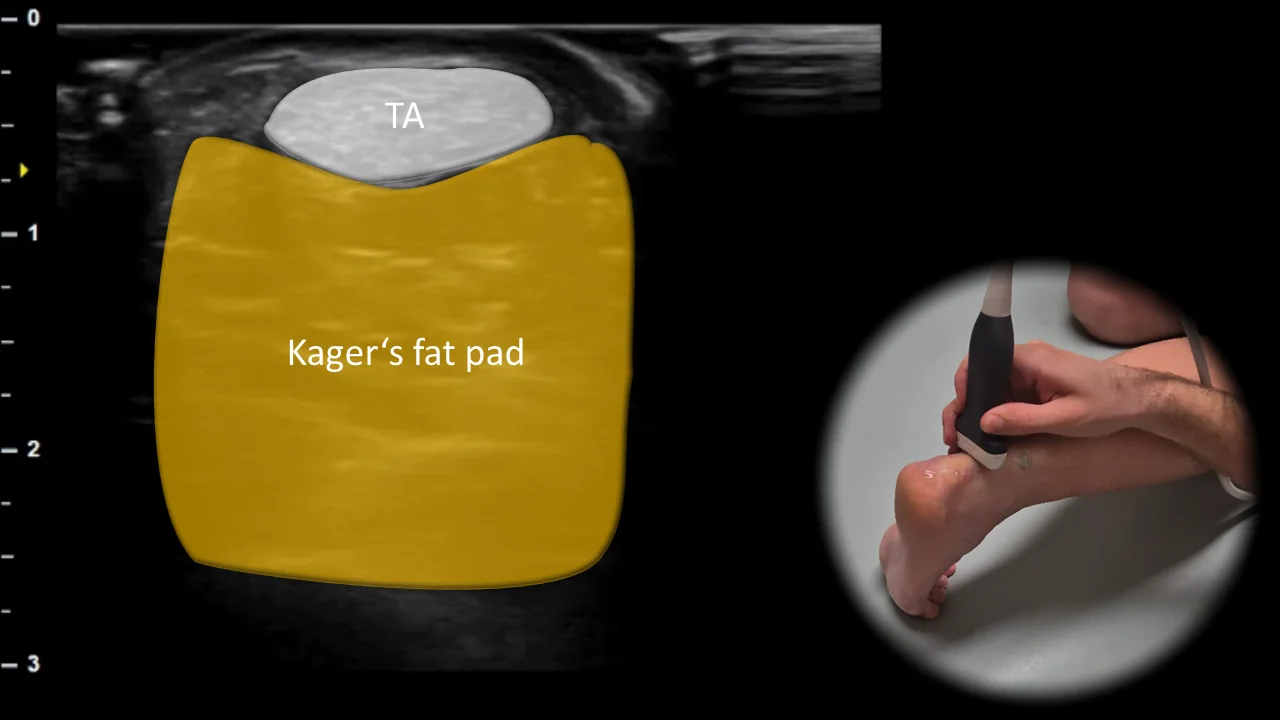
Figure 7. Dorsal view, transverse plane. TA: Achilles tendon
Transverse ultrasound section of the posterior ankle showing the Achilles tendon (TA) as an oval fibrillar structure located superficially above Kager's fat pad. Kager's fat pad forms a homogeneous soft tissue space ventral to the Achilles tendon and represents an important landmark for this projection. This projection is essential for evaluating the thickness, echostructure and continuity of the Achilles tendon and for detecting tendinopathy, partial ruptures or changes in surrounding soft tissues.
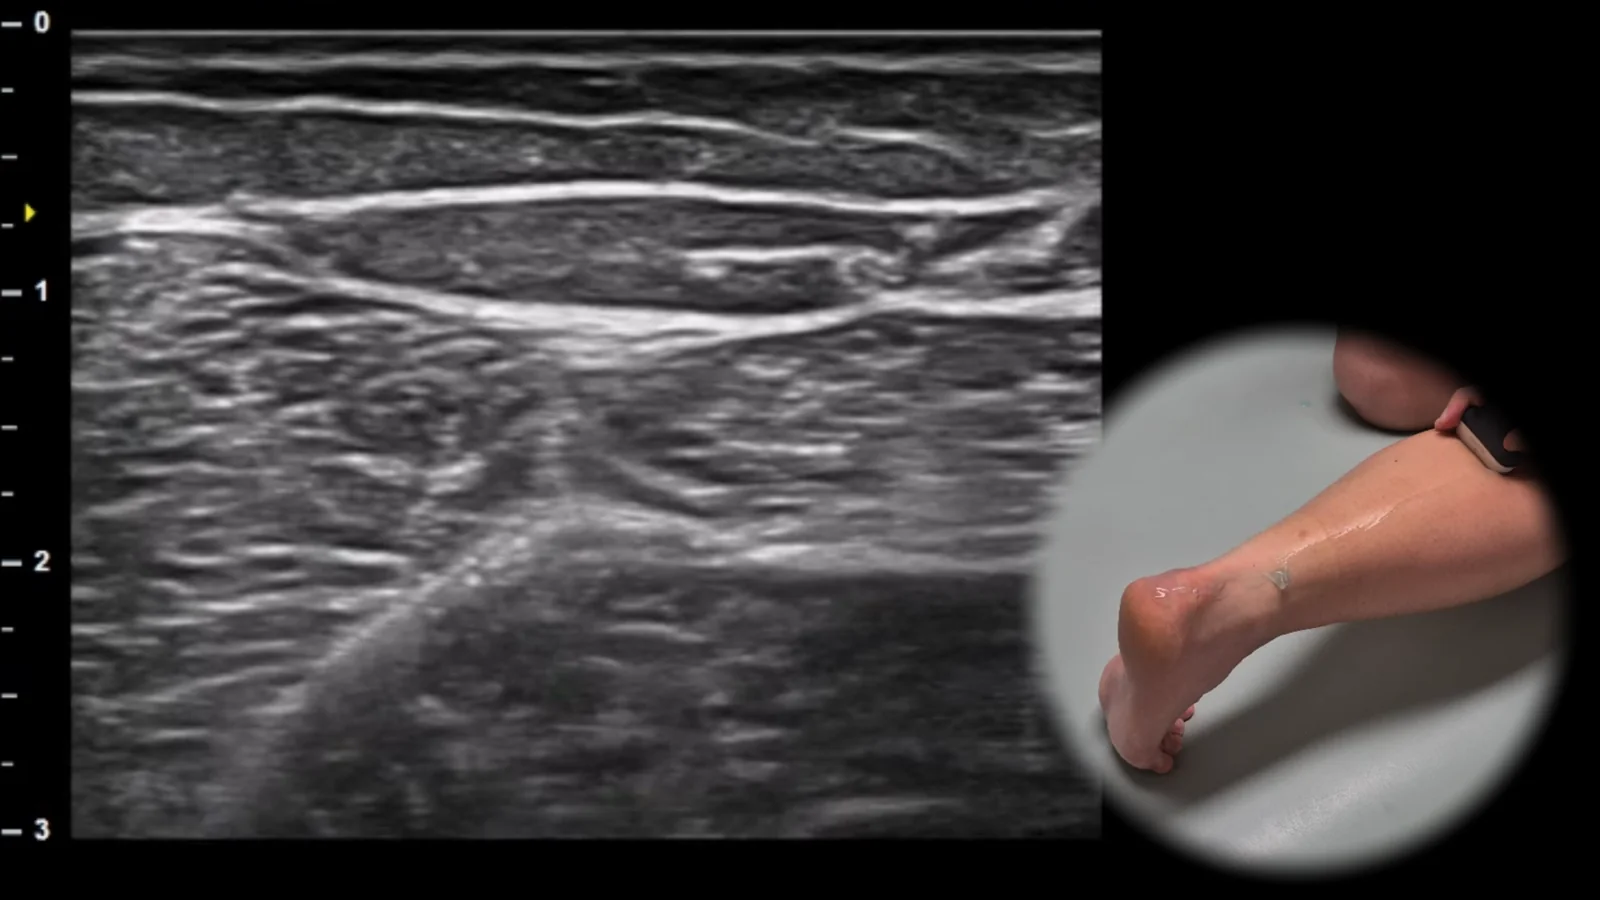
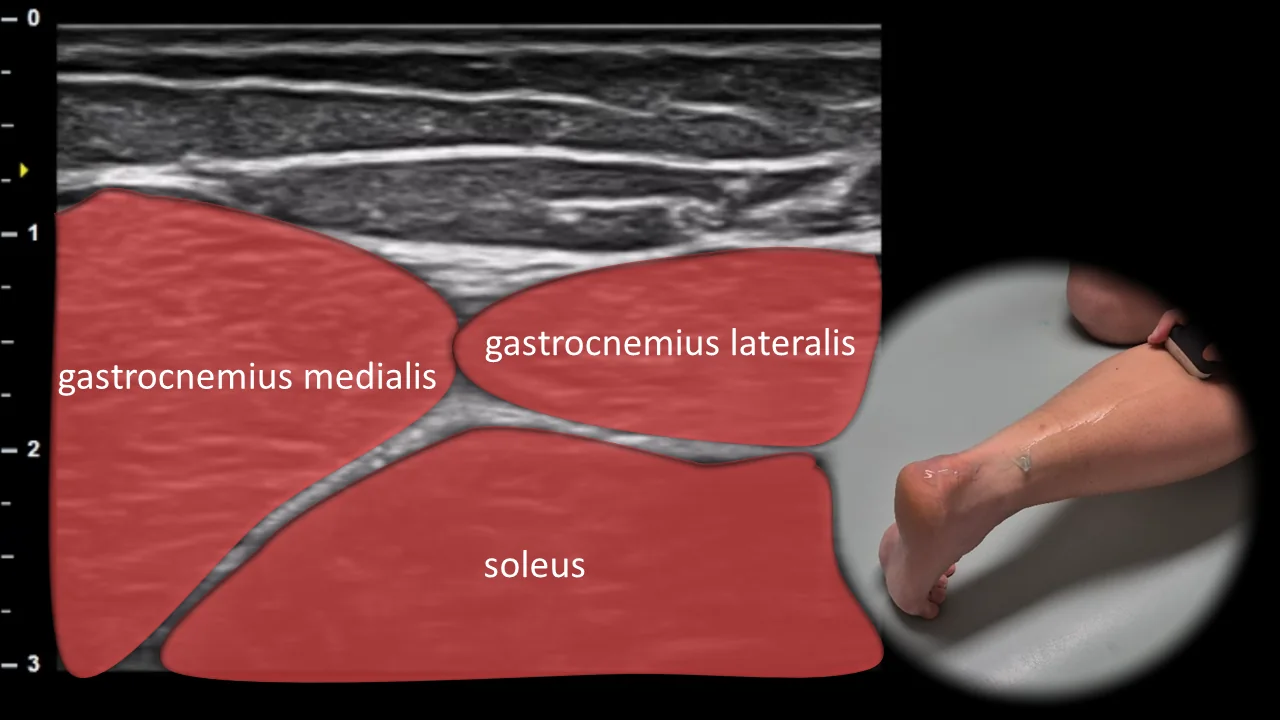
Figure 8. Dorsal view, transverse plane.
Transverse ultrasound section of the posterior part of the leg showing the muscle group m. triceps surae. Superficially, the medial and lateral heads of m. gastrocnemius are visible, between which the deeper m. soleus lies, forming the floor of this projection. This arrangement allows for clear visualization of the mutual anatomical relationships of the individual parts of triceps surae. This projection is essential for evaluating muscle architecture, detecting myotendinous injuries, and assessing chronic changes such as atrophy or fibrosis.
5. Plantar View
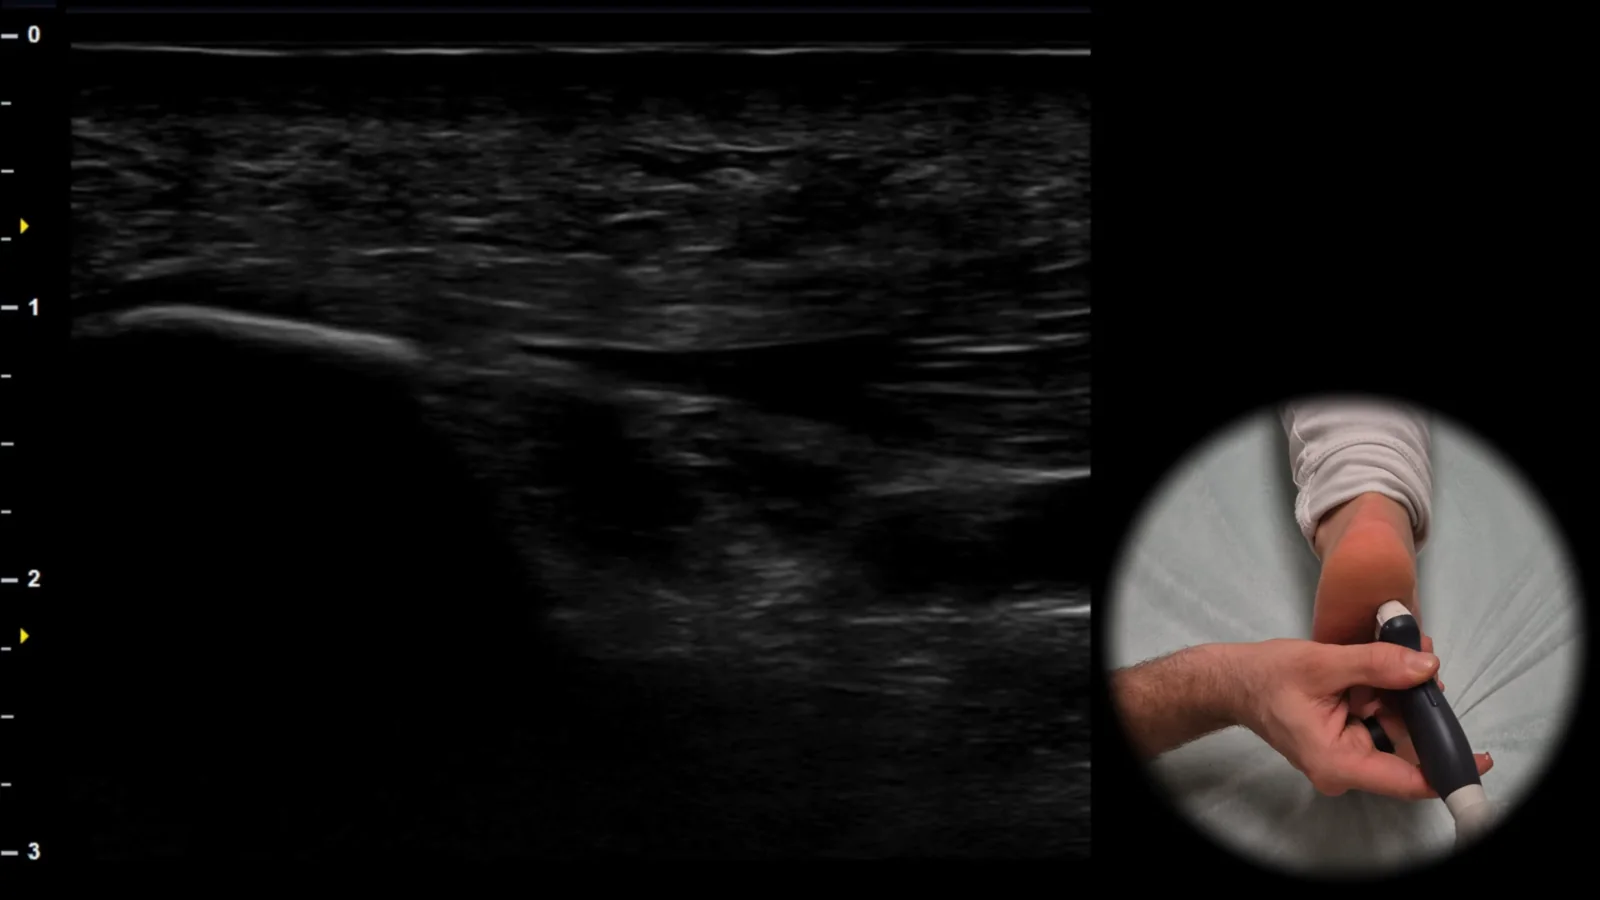
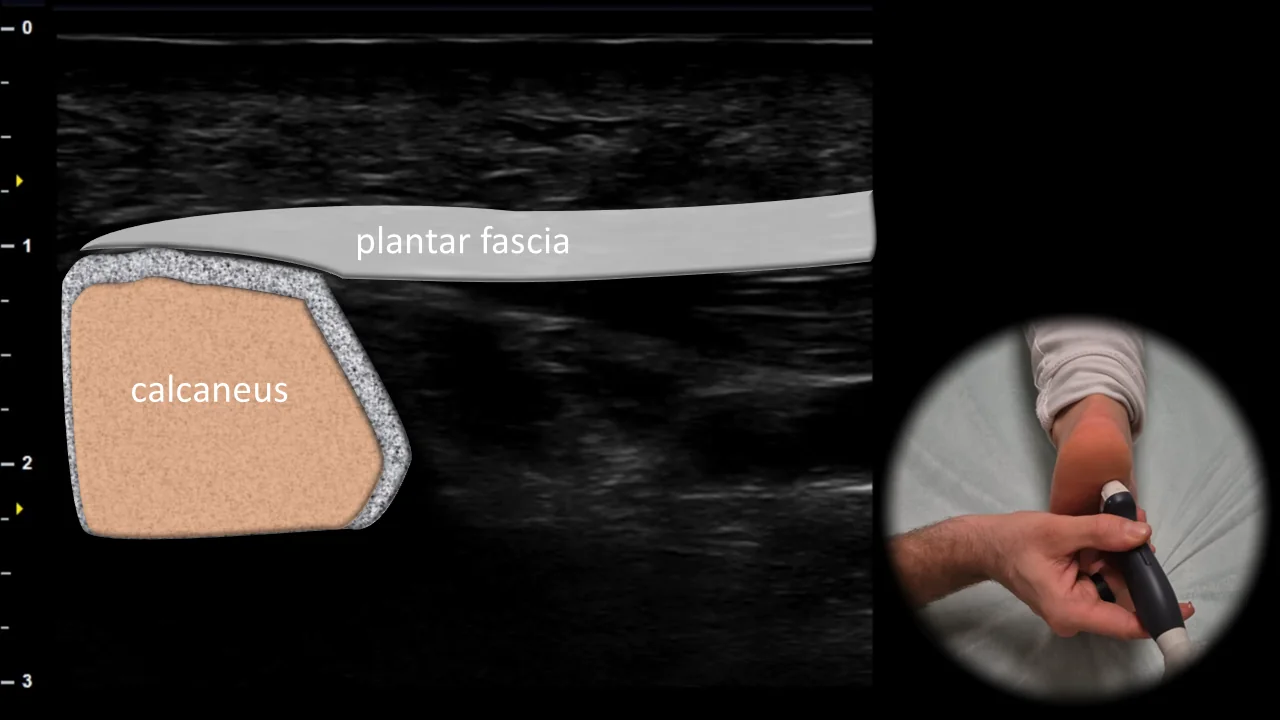
Figure 9. Plantar view, sagittal plane. View of the plantar fascia insertion on the calcaneus
Longitudinal ultrasound section of the plantar aspect of the heel showing the plantar fascia at its insertion site on the calcaneus. The plantar fascia is visible in this projection as a fibrillar hyperechoic band adjacent to the plantar contour of the calcaneus, which forms the main bony landmark of this region. This projection is essential for evaluating the continuity, echostructure, and thickness of the plantar fascia at the insertion site, with thickening over 4 mm potentially indicating plantar fasciitis.
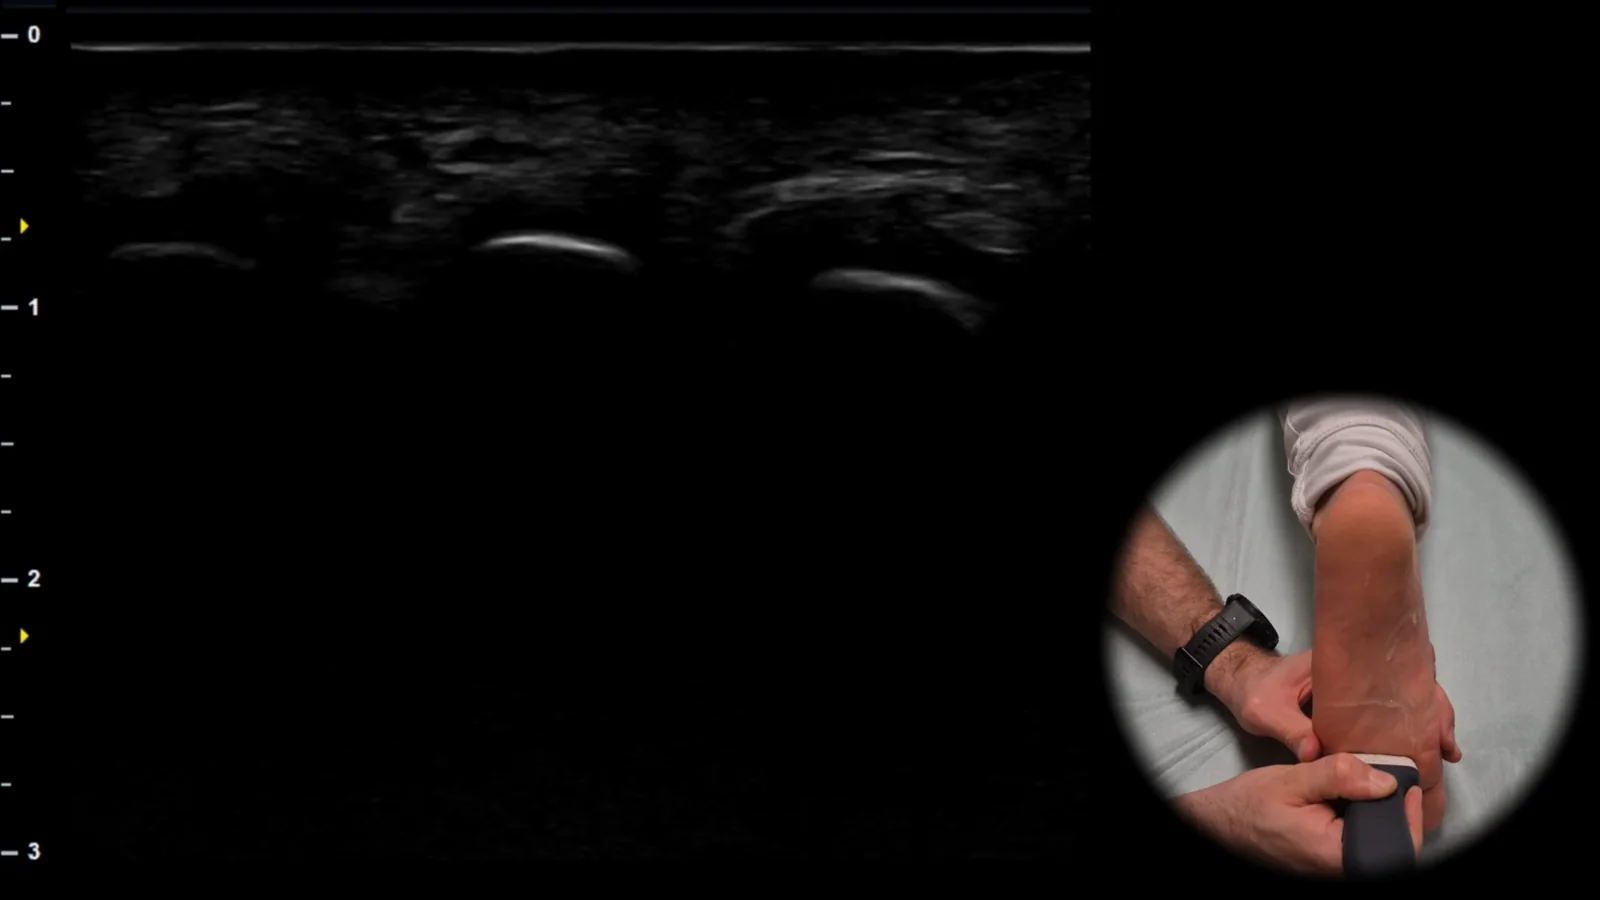
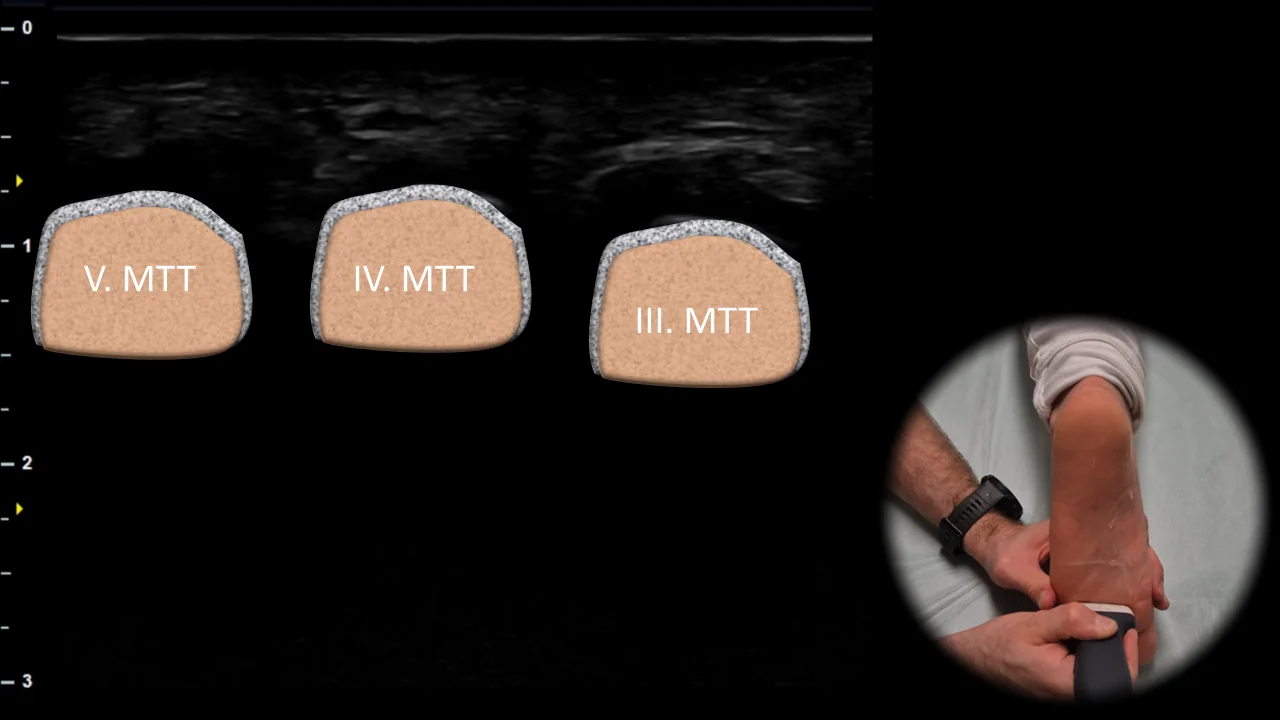
Figure 10. Plantar view, transverse plane. MTT: metatarsals
Transverse ultrasound section of the plantar part of the forefoot at the level of the metatarsal heads. In this projection, the metatarsal heads and intermetatarsal spaces are visible, which form the main anatomical landmarks when examining the plantar part of the forefoot. This projection is essential for evaluating the intermetatarsal spaces and for detecting pathological structures, especially Morton's neuroma. Clinical note: during dynamic examination, Mulder's maneuver can be performed, which is mediolateral compression of the forefoot that may lead to plantar bulging of the neuroma and be accompanied by painful clicking.
6. View of the I. MTP joint
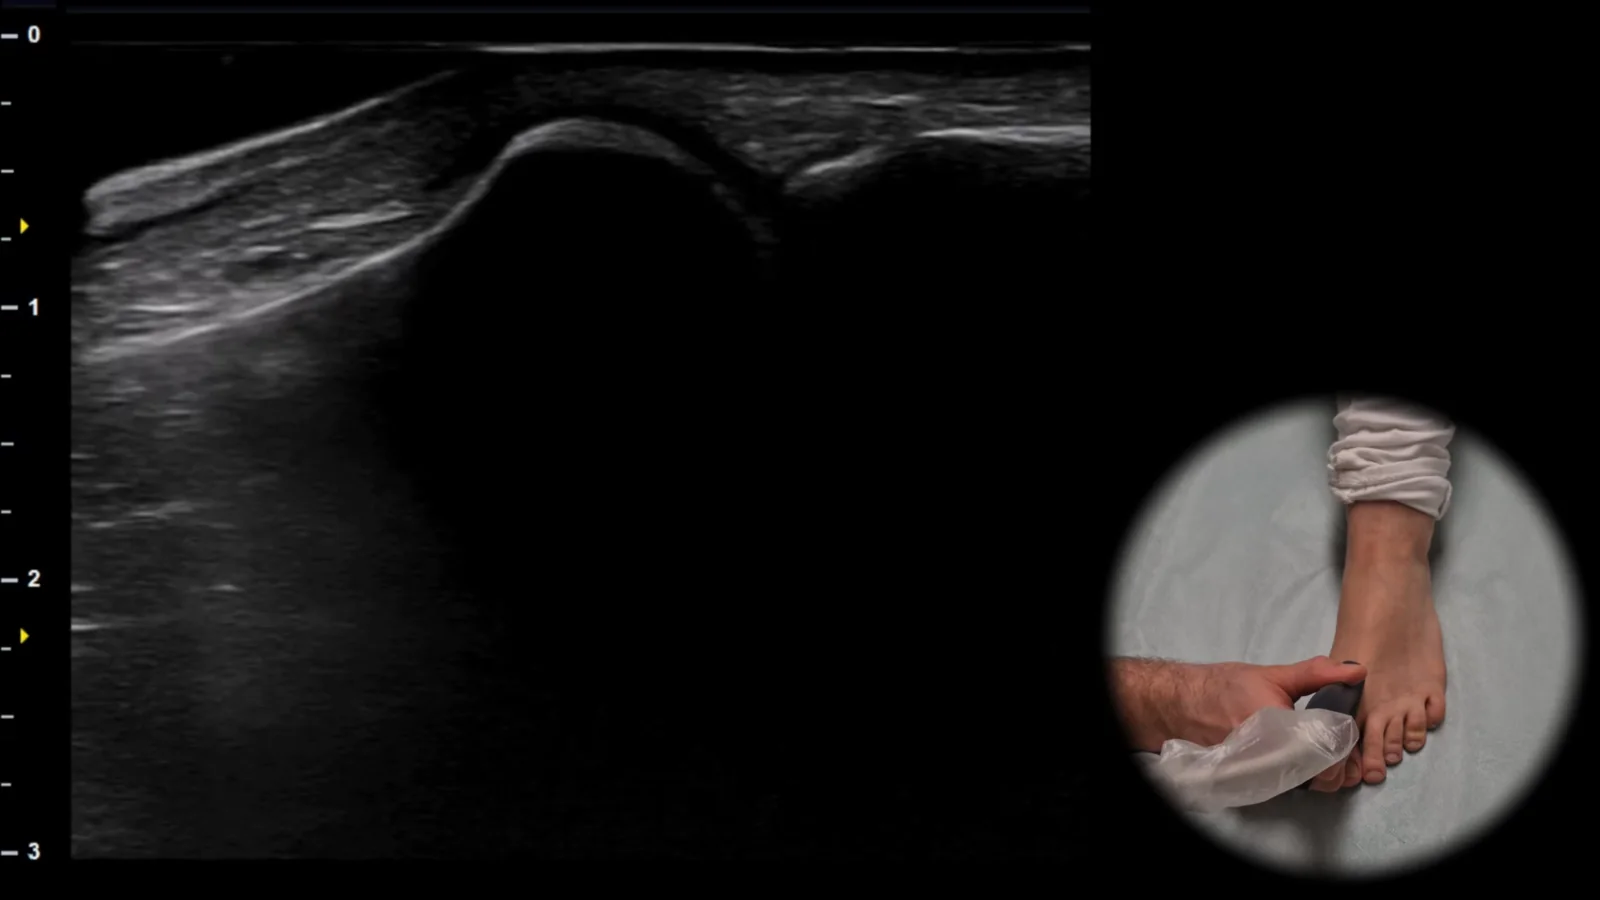
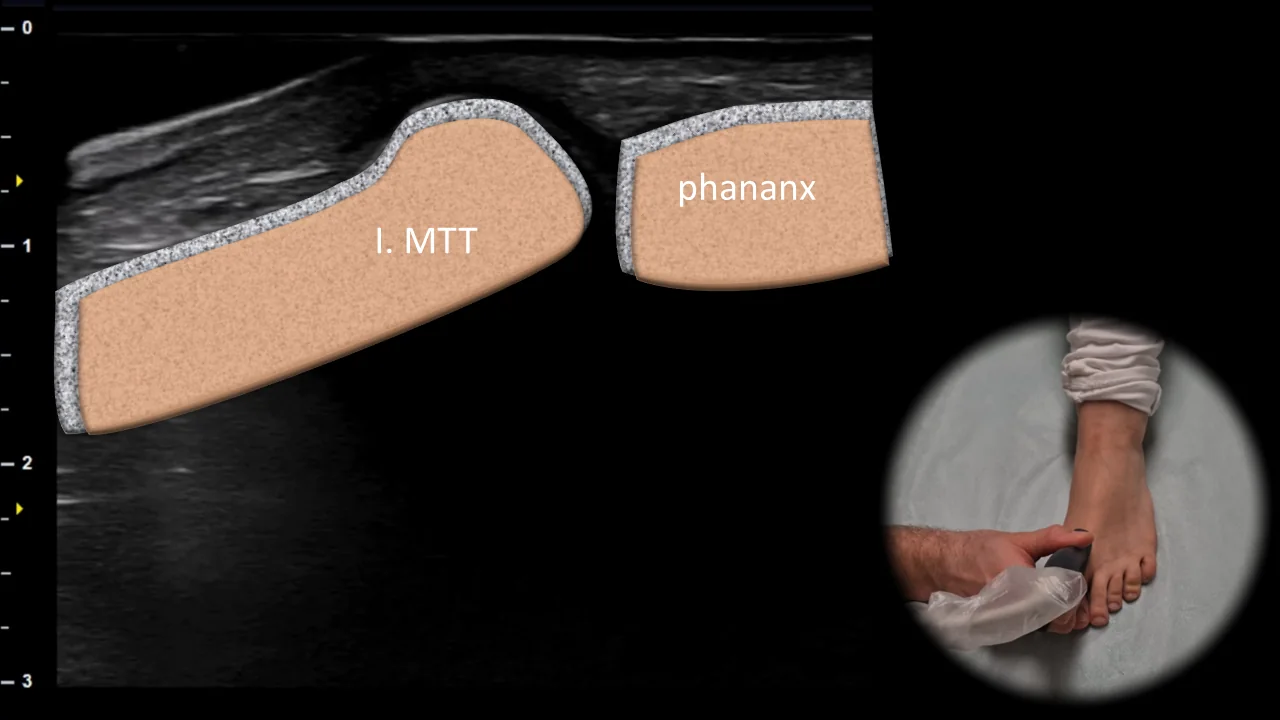
Figure 11. View of the first MTP joint, sagittal plane. I. MTT: first metatarsal
Longitudinal ultrasound section of the first metatarsophalangeal joint area showing the head of the first metatarsal (I. MTT), base of the proximal phalanx, and the joint space between them. The bone contours of both articulating surfaces form the main reference points of this projection and allow clear visualization of the joint surface in the long axis. This projection is essential for evaluating the contour of joint surfaces, presence of osteophytes, signs of arthrosis, and possible deposits of urate crystals typical for gout.
Unlock the full Health Library
Full access to scanning protocols, anatomy, and clinical references. Cancel anytime.
- Every protocol and anatomy reference
- Original ultrasound illustrations and video demonstrations
- Sync across mobile and web